Introduction
The initial idea for SPACExRACE, a site that focuses on the intersection between racial identities in America and geographic spatiality, grew out of my experience in an Ethnic Studies class my freshman year at UC Berkeley.
This class introduced me to the works of George Lipsitz, a professor in the Department of Black Studies at UC Santa Barbara whose works focus on social movements, urban culture, and inequality. One of Lipsitz’s most famous articles, “The Racialization of Space and the Spatialization of Race”, keys in on how housing segregation has marked the racial and spatial landscape in the US.
This article caught my attention for one particular reason: it completely changed my outlook on my hometown of San Rafael, CA and the surrounding Marin County. I had always noticed, particularly in high school, that Marin County served as a unique demographic case study. While the Marin I experienced seemed fairly homogenous, with a substantial white population and very little variation from district-to-district, there were certain neighborhoods within Marin that were very different from the norm. They featured large Hispanic or African American populations, were seemingly in a much more dilapidated state than the rest of Marin, and were often tucked away in nooks and corners of the county.
As a privileged teen who grew up attending a private college preparatory high school, my interaction with these parts of Marin was limited to superficial experiences like school-run community service projects. But, after learning about the connection between race and space at Berkeley, I made it a goal of mine to learn about the parts of my hometown that I was sheltered from in high school. This is truly the second inspiration for the content and focus of SPACExRACE.
So, for this background research page, my goal is to study one of the aforementioned ‘atypical’ communities within Marin: the Canal District. This page will provide a general overview of Marin County, briefly explore the history of the Canal District, and then delve into the factors that differentiate this communities from the rest of Marin.
Overview of Marin | Overview of the Canal District | Researching the Canal District | Is the Canal Different? | Why Is It Different?
General Overview of Marin
Marin County, CA is located just north of San Francisco, and is connected to the city by the Golden Gate Bridge. The area is known for its beautiful natural environment, liberal political slant, and its overall affluence. You can find more in-depth information about Marin by accessing its visitor’s bureau site, going to the local newspaper’s site, or taking a look at the county’s well-sourced Wikipedia page. But for the purposes of this overview, I want to key in on Marin’s affluence and demographics.
Affluence
-
As of May 2009, Marin had the fifth highest income per capita out of any county in the United States, at an average household per capita income of $91,480 [Source]
-
Various rankings from 2006-2010 consistently placed Marin among the top 20 wealthiest counties in the United States [Source]
-
Median personal earnings in Marin compare favorably with places like Fairfax, VA, Orange County, CA, and the Upper West Side of Manhattan [Source]
-
Median personal earnings in Marin are also 40% higher than California state medians [Source]
Given these data points, it is easy to place Marin among the wealthiest counties not just in California, but in the United States altogether. But while these statistics make Marin seem like the county version of Beverly Hills, with wealth available to all, the reality is very different:
-
Median personal earnings in Marin can range from $21,000 per year to $81,000 per year [Source]
-
The top fifth of Marin taxpayers in terms of personal income take home 71% of the county’s total income, while the bottom fifth of taxpayers take home 1.3% of the county’s income [Source]
-
Marin’s fastest growing job segment is low-wage service industries, like laundry, dry cleaning, and gardening, where the median income is $23,500 [Source]
These numbers complicate Marin’s wealth narrative, and ultimately play a major role in describing the economic realities in neighborhoods like Marin City and the Canal District. More to come on this.
Demographics
In addition to its affluence, Marin is noted for being fairly homogenous from a demographic standpoint. Data from the 2010 US Census indicates that Marin has a population of 252,409 overall, with the following breakdown across racial groups (the overall U.S. population breakdown is also presented as a point of comparison):
|
Demographics |
Marin County Population (2010) |
U.S. Population (2010) |
|
White |
72.8% |
63.7% |
|
Hispanic or Latino (of any race) |
15.5% |
16.4% |
|
Asian |
5.5% |
4.7% |
|
Two or more races |
4.2% |
1.9% |
|
Black or African American |
2.8% |
12.6% |
|
American Indian and Alaska Native |
0.6% |
0.4% |
|
Native Hawaiian and Other Pacific Islander |
0.2% |
0.9% |
Overall, Marin has a larger White population and a significantly smaller Black population than the overall US population. But beyond those distinctions, it seems as if Marin’s racial breakdown roughly corresponds with that of the rest of the country, particularly in comparison with the county’s racial identity over time:
|
Demographics |
2010 |
2000 |
1990 |
1980 |
|
White |
72.8% |
78.6% |
84.6% |
89.8% |
|
Hispanic or Latino (of any race) |
15.5% |
11.1% |
7.4% |
4.2% |
|
Asian |
5.5% |
4.5% |
4.0% |
3.0% |
|
Some other race |
6.7% |
4.5% |
N/A |
N/A |
|
Two or more races |
4.2% |
3.5% |
N/A |
N/A |
|
Black or African American |
2.8% |
2.9% |
3.5% |
2.5% |
|
American Indian and Alaska Native |
0.6% |
0.4% |
0.4% |
0.4% |
|
Native Hawaiian and Other Pacific Islander |
0.2% |
0.2% |
N/A |
N/A |
In particular, it appears that the growth of Marin’s Latino population, from 4.2% in 1980 to 15.5% in 2010, has cut into the region’s large White population, bringing the percent of White residents in Marin down from around 90% in 1980 to 72.8% in 2010.
This is an important point to consider as we move into a brief history of the Canal District.
[Above Data from US Census 2010 and this report from the Marin Economic Commission]
Key Takeaways
-
Marin is one of the wealthiest counties in the United States, but wealth inequality across the county is substantial and growing.
-
Marin has a larger White population and a smaller Black population than the rest of the country, but its demographics are more in line with national averages than they have been historically.
- This change in Marin’s population can be attributed to the growth of Marin’s Latino population.
Brief Overview/History of the Canal District
Marin County’s Canal District is located in San Rafael, CA. The district is comprised of two neighborhoods in the central part of the city, surrounded by the San Francisco Bay, the San Rafael Canal, and by the 101 Highway (MTA Community Profile).
The area provides much of Marin’s low-income housing, including large apartment buildings, condominium complexes, townhouses, and duplexes. It is also home to most of the county’s older industrial and newer light industry jobs, providing over 15% of the jobs in the San Rafael area [Source].
According to Tom Wilson, director of the Canal Alliance, a prominent community center in the neighborhood, the area was first developed in the 1950s and as a low-income housing area for new college graduates: “The housing stock was largely studios and small apartments not really intended for families.”
But over time, waves of immigrants who ended up in Marin were attracted to the low-income housing and the low-wage service jobs in the area. Many refugees of the Vietnam War from Vietnam, Laos, and Cambodia settled in the area during the 1960s, and the 1980s brought immigrants from Central America who had fled civil wars in El Salvador and Guatemala. Over the span of a couple of decades, the Canal District went from housing young couples and college grads to becoming a distinct immigrant neighborhood.
“It really formed the way a lot of ethnic and immigrant neighborhoods form,” said Wilson. “In 25 years, [the neighborhood] went from almost no immigrants at all to being in the high 90 percent of those here are immigrants or their parents were.” [Source]
Today, the area houses nearly half of Marin County’s entire Latino population, and carries a substantial immigrant population [Source].
Researching the Canal District
In the introduction to this page, I mentioned the Canal District as an example of the type of neighborhood that I saw as being ‘different’ from the typical Marin experience while I grew up in the area. My perception of the Canal as ‘different’ came entirely from the area’s large immigrant community, its low-income housing, and its lower end, service-based economy. These things clashed with the majority-White, high-income, technology-based economy that I had seen growing up in Marin.
But are these observations accurate, or did I simply have a distorted view of what Marin really is? Is there data to back up my assumptions?
If I had tried to investigate this more than a year ago, it would have been extremely difficult to come across the numbers that would have helped me answer these question. But, just last year, a group called Measure of America partnered with the Marin Community Foundation to release a report entitled: “A Portrait of Marin: Marin County Human Development Report 2012”. The report’s self-stated goal was to “bring greater awareness and understanding of the complexities of life in Marin County, particularly ones that address such critical issues as health, education, and income”.
But, even more generally, one of the report’s main goals was to examine the baseline assumptions that guide daily life in Marin.
“We often describe ourselves, and certainly hear others describe us, in terms of average household income, average test scores of students, and the average cost of a home,” wrote Thomas Peters, President and CEO of the Marin Community Foundation. “If that’s the end of the story, then Marin would warrant its reputation and the clichés that go with it…but these averages don’t do justice to the realities that many residents face every day.”
By digging deeper than the averages, “A Portrait of Marin” was able to unearth the realities of life in Marin for those residents who felt misrepresented by the averages. The conclusions that the report drew, and its particularly in-depth research on the Canal District, was what ultimately allowed me to explore my assumptions regarding the area.
Is the Canal District Actually Different?
So what did I learn? Let’s start with the numbers (all numbers below are sourced from “Portrait of Marin”).
In order to fully examine the quality of life across the entirety of Marin, the “Portrait of Marin” report examined key metrics by Census tracts, which offer a good approximation of different neighborhoods.
The high-level findings are astonishing. Measuring each neighborhood by the Human Development Index (HDI), a comprehensive measure of quality of life, the report found that the city of Ross, CA had the highest score (9.70) across all of Marin. The Canal District had the lowest index score in the county with 3.18 – a score lower than that of West Virginia, the lowest ranked state in the nationwide index.
The following statistics are characteristic of Ross residents:
-
Life expectancy of 88 years – a decade longer than the national average
-
Four out of five adults have a bachelor’s degree or higher
-
Median personal earnings are $64,378 – more than double the national average
-
Racial breakdown: 90% White, 5% Latino
And the following statistics are characteristic of residents of the Canal:
-
Life expectancy of 80.5 years – 7.5 years shorter than Ross residents
-
Less than half of adults have a high school diploma
-
Median personal earnings are $21,000 – equivalent to the national average in the 1960s
-
Racial breakdown: 76% Latino, 13% White, 8% Asian
These numbers highlight the immense disparity in health, educational achievement, wealth, and demographics across two neighborhoods located less than 15 minutes away from each other in the same county.
Now, while the Ross-Canal District comparison allows for some eye-popping numbers, the comparison itself might not be entirely fair. A better measure of the Canal District’s overall well-being would be to compare it with the rest of the county, not just the county’s most well-off parts. Luckily, the “Portrait of Marin” also provides us with mapped comparisons of Census tracts by measures of health, education, and income.
Health:

Average life expectancy by Census tract in Marin (2010)
Education:

Education index score by Census tract in Marin (2010)
Income:

Median earnings by Census tract in Marin (2010)
These maps tell a familiar story – by nearly every measure, the Canal District finds itself at the low end of Marin’s health, education, and income data. For some, like Canal Alliance director Tom Wilson, these results are unsurprising.
“It’s no surprise to me that the population of the Canal neighborhood would be rated way below that of Ross,” said Wilson. “It’s not only an immigrant community, but a self-selected group of immigrants: people who came here because they were fleeing oppression, poverty, war and any number of other traumatic events. And about half that population are indigenous peoples, who might speak Spanish as a second language or not at all. It’s a unique group.” [Source]
Why is the Canal Different?
This question cuts to the core of the issue: why is it that the Canal District has the developed the way it has?
And though there are no clear-cut answers to this question, it appears that the topic of housing segregation, which I covered in-depth on another one of my background pages, plays a major role here. In 2009, the US Department of Housing and Urban Development (HUD) audited Marin’s fair housing practices and was alarmed by the concentration of minority residents in certain areas of the county. The HUD report noted that “even among even among its relatively small minority population, persons of Black race and Hispanic ethnicity are largely clustered in two minority-impacted census tracts,” including the Canal District and Marin City near Sausalito [Source].
The report also pointed to research conducted by the non-profit agency Fair Housing Marin in 2008. The agency had both black and white apartment hunters with similar profiles call landlords with housing listings on Craigslist. One-third of the landlords reached responded less favorably to the black renters, while also offering white renters lower rents, more flexible terms, and more information about other available units [Source].
Exclusionary renting practices aside, there are other potential reasons for the restriction of minority residents to areas like the Canal District and Marin City. The Canal has become a desired location for many low-income residents because of its robust public transportation system, which allows residents to get around without a car. But limited public transportation options around the rest of the county makes it difficult for low-income residents to move into low-income housing in other parts of Marin.
“[Canal residents’ say they’d like to live in Ross Valley, they’d like to get an apartment in Kentfield,” said Marin County Supervisor Judy Arnold. “But bus service isn’t so convenient.” [Source]
Another potential issue is the county’s mismanagement of federal funds designated for low-income housing, an allegation that was also brought up in the HUD’s 2009 audit of Marin’s housing practices. This includes a failure to track the ethnicity of the beneficiaries of federal funds and a failure to carry out multilingual outreach campaigns for federally subsidized housing. While the county claims that an overall lack of funding has caused these issues, given that the county receives less than $3 million annually from the government to promote low-income housing, some activists suggest that there is a more insidious force at play.
“[County officials] have these old boy networks,” said John Young Jr., director of Marin Grassroots, a Marin-based community coalition. “The diversity of the county never grows because it’s the same people getting the same opportunities.” [Source]
Between housing discrimination, infrastructure issues, and potential government mismanagement, it is clear that a variety of systemic, structural issues have put the residents of places like the Canal district in the tough position they are in today. For more information on Marin County’s history with issues of fair housing, go ahead and click on the timeline below:
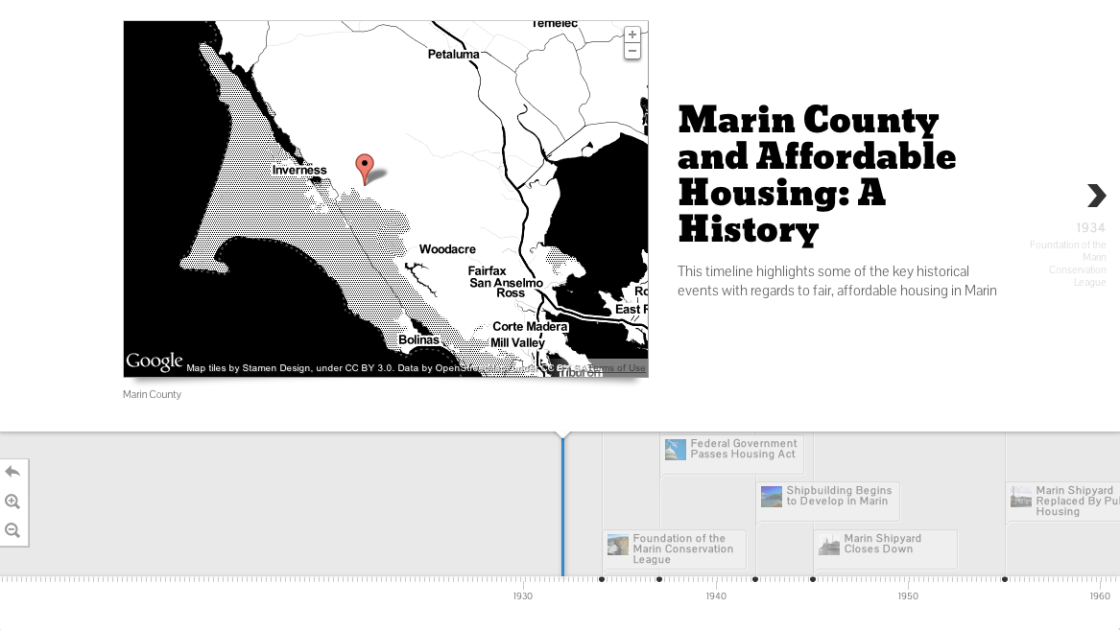
Marin County and Affordable Housing: A History
Sources for Timeline:
- County of Marin Board of Supervisors
- SF Gate
- Hamilton Project
- KQED Report on Fair Housing
- EAH Website
- BART History
- KQED Report on Canal/Marin City
Conclusion
My goal, in researching the Canal District, was to unearth the reality behind the surface-level perceptions I had developed while growing up in Marin. And while I certainly found information that reshaped my thinking with regards to the area, much of my research also, sadly, confirmed the level of inequality that I had perceived between the Canal and the rest of Marin.
I know that this research has inspired me to do more to help close this gap. If you are interested in finding out more about efforts that support areas like the Canal District, check out the Canal Alliance, a community organization dedicated to helping the area. To find similar organizations in your community, check out VolunteerMatch and GreatNonProfits.
